Co-authored by: Oliver Moloney (Chief Investment Officer) and Caoimhe Lane (Investment Analyst).
Welcome to our 2025 market outlook. In this article, Oliver Moloney, our Chief Investment Officer, will highlight some of the key areas of focus for markets and investors for the coming year, and what that means for client portfolios.
The valuation conundrum in equities – expensive but not the time to sell.
In short, yes, US equities are overvalued versus their own history, and versus all other equity markets globally. Part of this premium is the higher quality makeup of the US market when compared to its own history and to other equity regions, however it is difficult to argue that US markets are “fairly valued.” The sudden focus on AI has given the tech sector a further lease of life which has pushed valuations to new heights as the technology has yet to contribute in a major way to earnings.
The Price-to-Earnings ratio of the S&P 500 has increased from 19 times at the end of 2022 to 27.8x at the end of 2024 (+45%), accounting for a significant portion of total returns in that time period. What is remarkable is that this run has coincided with a period of historically high interest rates.
Table 1: Major index PE ratios
| Index | Dec-22 | Dec-23 | Dec-24 | Valuation Change Full Period | Total Return Full Period |
| Nasdaq | 23.7 | 32.4 | 36.0 | 51.8% | 95.3% |
| S&P 500 | 19.2 | 24.1 | 27.8 | 44.7% | 57.9% |
| FTSE 100 | 11.1 | 10.3 | 15.6 | 40.7% | 18.4% |
| EuroStoxx 50 | 12.8 | 13.3 | 15.8 | 23.1% | 37.8% |
| ISEQ 20 | 14.1 | 11.0 | 11.1 | -21.6% | 42.0% |
Other regions have also experienced similar run-ups in their valuations, albeit from a much lower base level. The question here is at what point can other regions begin to catch up with the US? There has been a distinct separation in US equities versus the rest of the world since 2009. Buying lower valuation regions has not added to investor returns in over a decade. With the US economic outlook looking stronger than Europe, it is unlikely that the performance gap will reverse in the short term.
Graph 1: US equities versus the rest of world developed markets.
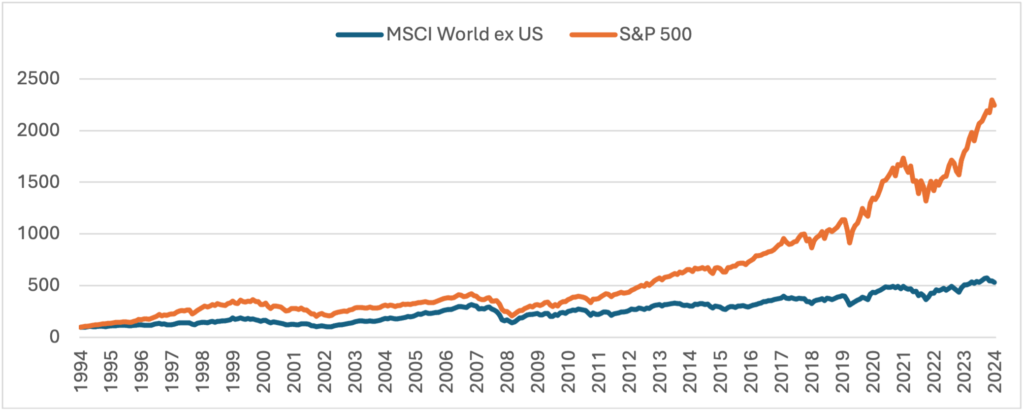
| Period | MSCI World ex US | S&P 500 | Difference |
| Annualised 1995 – 2009 | 5.7% | 8.0% | 2.3% |
| Annualised 2010 – 2024 | 5.8% | 13.9% | 8.1% |
| Full Period | 5.7% | 10.9% | 5.2% |
Source: Refinitiv. 30-year total returns (1995 – 2024) in USD terms.
What does that mean for investors?
This valuation tailwind cannot continue in perpetuity and, as a result, is likely to be a headwind for forward looking returns.
As always, the recommendation for those invested is to remain invested. Similarly, for those looking to implement a long-term strategy, the recommendation is not to change course. Markets are expensive yet have not shown signs of excessive risk-taking. This may mean returns will be lower going forward; however, equities remain the core of any long-term investment strategy.
The outlook for economic growth in the US is robust and we are in a rate cutting cycle, both of which offer constructive reasons to own equities in the near term.
Simple valuation metrics are not useful in timing markets. While the US is overvalued versus history and other regions, the UK and Europe are trading around their longer-term averages.
Global equities are unlikely to repeat the strong performance of 2023 (+19.2%) and 2024 (+24.4%) however, returns are still likely favourable when compared to longer-term bond yields on offer. The key is to remain diversified across equity styles, sectors, and regions to ensure that any one risk (including valuation reversals) does not have an outsized impact on performance.
The rate cutting cycle – nearly there in the US, more to go in Europe.
Central banks find themselves in a tricky spot as we tip into 2025. They want to boost economic growth yet avoid a resurgence in inflation figures from 2021. Historical increases in central bank policy rates through 2021 and 2022 caused a sudden shock to bond markets while also eventually bringing inflation back down towards its 2% target. Fortunately, policymakers did seem to achieve a “soft landing.” Despite policy rates of 4-5%, economic activity and employment remained strong throughout.
Expectations for rate cuts continue to be pushed out and the forecast for cuts in 2025 are muted: a further 1% in Europe, and 0.6% by the FED and BOE. We have even seen some prominent market strategists highlight the increased probability that the FED hikes rates in 2025.
Table 2: Interest rate expectations for the FED, ECB, and BOE in 2025.
| Date | US FED Funds Target Rate | ECB Deposit Rate | UK (BOE) Base Rate |
| Jan 25 | 4.3% | 2.7% | 4.5% |
| Feb-25 | 4.3% | 2.7% | 4.5% |
| Mar 25 | 4.2% | 2.4% | 4.5% |
| Apr-25 | 4.2% | 2.2% | 4.5% |
| May 25 | 4.2% | 2.2% | 4.4% |
| Jun-25 | 4.1% | 2.1% | 4.3% |
| Jul 25 | 4.0% | 2.0% | 4.3% |
| Aug-25 | 4.0% | 2.0% | 4.2% |
| Sept 25 | 4.0% | 2.0% | 4.2% |
| Oct-25 | 4.0% | 1.9% | 4.2% |
| Nov 25 | 4.0% | 1.9% | 4.2% |
| Dec-25 | 3.9% | 1.9% | 4.1% |
| Total Expected Change in 2025 | -0.57% | -1.06% | -0.60% |
Source: Refinitiv. Interest rate probabilities.
We expect central bank policies to diverge in 2025 depending on the region.
The economic outlook in the UK and Europe looks somewhat fragile and this is likely to continue to put downward pressure on yields. In Europe, sluggish growth forecasts and with inflation in check make the case clear for a number of rate cuts. The UK is in the worst economic shape and is at risk of suffering from weak growth, but sticky inflation is making the rate decision more challenging. This is seen in the interest rate expectations.
On the flip side, US economic performance remains resilient. The fears of recession are firmly in the back of investors’ minds. When it comes to the US the focus is on the risk of inflation spiking again due to continued fiscal spending. As the region continues to borrow to fuel economic growth, the debt burden is likely to feed into higher long term bond yields. Until we get more clarity around Trumps fiscal policies, US yields are likely to trend sideways.
Bonds still offer investors a steady rate of return within the defensive part of their portfolio. Yields on offer across “risk free assets” are now in the 2.5-4.5% region offering a baseline for multi asset portfolios. Our preference is to remain cautious within the bond allocation. We saw through the sudden rate hiking cycle the impact of excessive risk (duration and/or credit risk) can have on what many believed to be low risk assets.
Table 3: Government benchmark yields.
| 1M | 3M | 1Y | 2Y | 3Y | 5Y | 7Y | 10Y | |
| US | 4.3% | 4.3% | 4.2% | 4.3% | 4.3% | 4.4% | 4.5% | 4.6% |
| Germany | 2.7% | 2.5% | 2.4% | 2.2% | 2.2% | 2.3% | 2.3% | 2.5% |
| UK | 4.8% | 4.6% | 4.5% | 4.4% | 4.2% | 4.4% | 4.5% | 4.7% |
Source: Refinitiv.
The second coming of Trump – ignore the noise
Many investors have asked how a Trump presidency will impact their investment portfolios. In truth, it is too early to assess the potential impact. The US is in a solid position compared to its global peers. Solid growth, a robust labour market, and inflation that is not excessive are a recipe for a strong economic backdrop. This would bode well for financial assets in the short term.
In theory if Trump implements his proposed policies – deregulation, higher tariffs, lower taxation, stronger immigration etc. – this would likely lead to higher inflation, higher rates, higher asset prices, and a stronger dollar. We have already seen the dollar move back below 1.05 from 1.12 at the end of Q3 2024.
Graph 2: USD appreciation versus EUR.
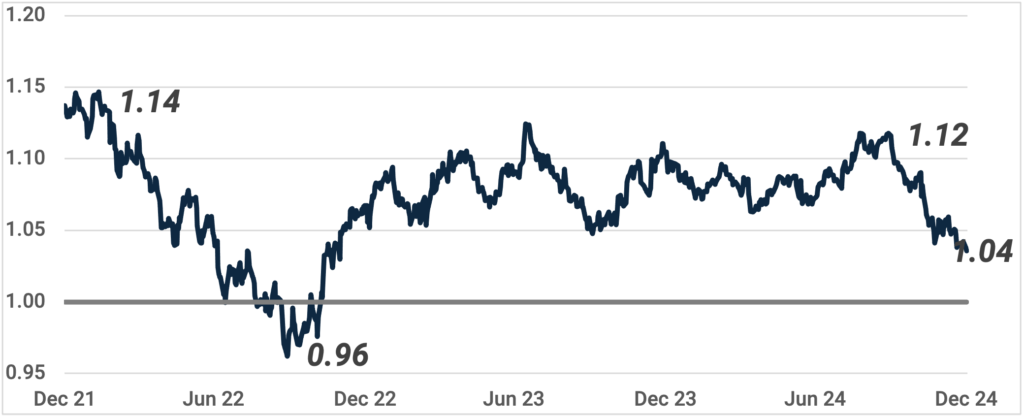
Source: Refinitiv.
In other regions such as China and Europe, tariffs are likely to be a headwind to economic growth. The nature and extent of tariffs are still to be determined and the sectors that will be affected quite specific (autos, technology, semiconductors etc.). Trump is likely to use tariff threats to renegotiate trade and other geopolitical deals in favour of America. This will benefit domestic US and result in an economic headwind elsewhere.
It is important to note many of Trump’s policies may not have a major impact in 2025.
Trump thus far has been positive for risk assets, from equities to cryptocurrencies. The strong dollar has also added to returns for Euro investors who held US denominated assets in 2024. The S&P 500 returned 25.0% in 2024 in USD terms, however, a Euro investor had a total return of 33.4% when adjusting for USD strength.
As we will discuss in our next section, Trump’s focus on deregulation has spurred hope that dealmaking, M&A, and IPO markets will open up, which will benefit private equity assets. Overall, there remains many unanswered questions, but thus far Trump has been a positive force on financial markets.
Private Equity – a return to activity
Private equity had experienced two years of slowing activity through 2022 and 2023 due to the high interest rate environment and general market uncertainty. 2024 was a recovery of sorts but activity remains below pre-pandemic highs.
IPO markets have been weak and regulators in the US and Europe have been tough and any major M&A activity, specifically within the tech sector. Higher interest rates also made it difficult for private equity firms to structure deals and use leverage. The result was that sponsors became creative in using alternative liquidity options such as leveraged dividends and private company sales. Ultimately, it was not enough, and PE distributions have been below expectations.
Trump is expected to be more favourable toward mergers and acquisitions, and with the interest rate environment stabilising, 2025 looks optimistic for PE deal making. Exit valuations and equity markets have recovered from a turbulent 2022 and are likely to prompt private equity funds to begin selling assets.
Reduced activity has resulted in private equity firms holding onto companies for longer. In a typical private equity fund the lifecycle is 10 years (with an option to extend to 12). The distribution cycle usually occurs from year 6 onwards however Pitchbook has noted the value of funds that have entered the latter years of their lifecycle is significant. These funds will likely use strong equity markets to start offloading assets and returning funds to investors.
Graph 3: Global PE Committed Capital by age (in years)
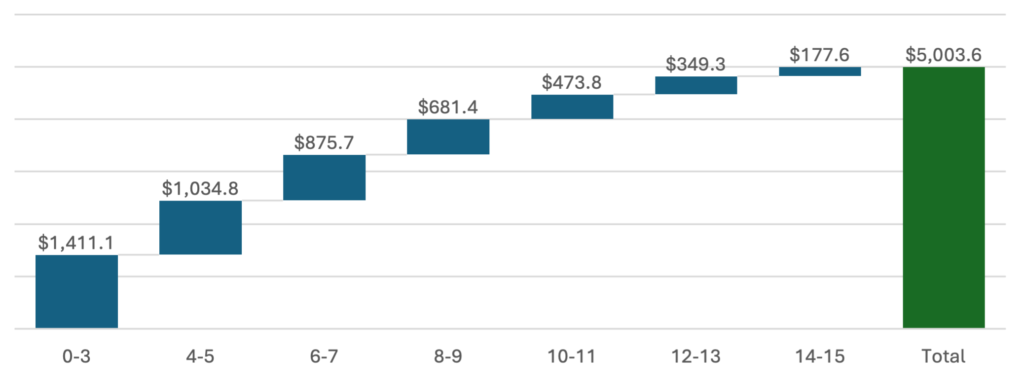
Source: Pitchbook 2025 US Private Equity Outlook
We enter 2025 with a sense of optimism for private equity investors.
| Index | 2020 | 2021 | 2022 | 2023 | 2024 | 5 Year Ann |
| NASDAQ | 44.9% | 22.2% | -32.5% | 44.6% | 29.6% | 17.5% |
| S&P 500 | 18.4% | 28.7% | -18.1% | 26.3% | 25.0% | 14.5% |
| TOPIX | 7.4% | 12.7% | -2.5% | 28.3% | 20.5% | 12.8% |
| MSCI World | 16.5% | 22.3% | -17.7% | 24.4% | 19.2% | 11.7% |
| Gold | 24.8% | -4.0% | -0.4% | 13.8% | 27.1% | 11.5% |
| EURO STOXX 50 | -2.6% | 24.1% | -8.8% | 23.2% | 11.9% | 8.7% |
| FTSE 100 | -11.5% | 18.4% | 4.7% | 7.9% | 9.7% | 5.4% |
| IBOXX $ Liquid High Yield | 4.7% | 4.5% | -10.7% | 12.9% | 7.9% | 3.5% |
| IBOXX EUR Liquid High Yield | 1.7% | 3.2% | -9.4% | 11.8% | 6.9% | 2.6% |
| MSCI Emerging Markets | 18.7% | -2.2% | -19.7% | 10.3% | 8.1% | 2.1% |
| IBOXX $ Corporates | 9.6% | -1.0% | -15.0% | 8.5% | 2.7% | 0.6% |
| IBOXX UK Gilts | 9.4% | -0.8% | -16.7% | 9.9% | 1.0% | 0.1% |
| IBOXX Euro Corporates | 2.7% | -1.1% | -14.2% | 8.2% | 4.6% | -0.3% |
| IBOXX US Treasuries | 8.3% | -2.5% | -12.9% | 4.1% | 0.5% | -0.8% |
| IBOXX UK Corporates | 8.6% | -3.2% | -18.4% | 9.7% | 2.2% | -0.8% |
| IBOXX Euro Govt Bonds | 5.0% | -3.4% | -18.4% | 7.2% | 1.8% | -2.0% |
| HANG SENG | -0.3% | -11.8% | -12.5% | -10.5% | 22.9% | -3.3% |
Table 4: Major index historical performance table